Case Study - Urban Company

Mobility Impact Report Design for Urban Company with Infographics and Data Visualization

Urban Company (formerly UrbanClap) partnered with banks and financial institutions to help its workforce get scooters. The mobility initiative needed a report that could show what changed for the workers, in numbers and in their own stories. DesignDemonz designed the complete Mobility Report for both print and digital, and handled the print production too.

Project Type

Mobility Impact Report Design

Design Deliverables

Infographics & Editorial Layout

Project Duration

2 Months

Platforms

Digital & Print

Industry

Home Services & Workforce Mobility

Industry Solutions

Impact Reporting, Data Visualization & Worker Stories

Core Design Areas

3 – Editorial Design, Infographics & Photography


Design Software

Adobe InDesign, Photoshop & Illustrator

Production

Digital Report, Print-Ready Artwork & Printer Coordination
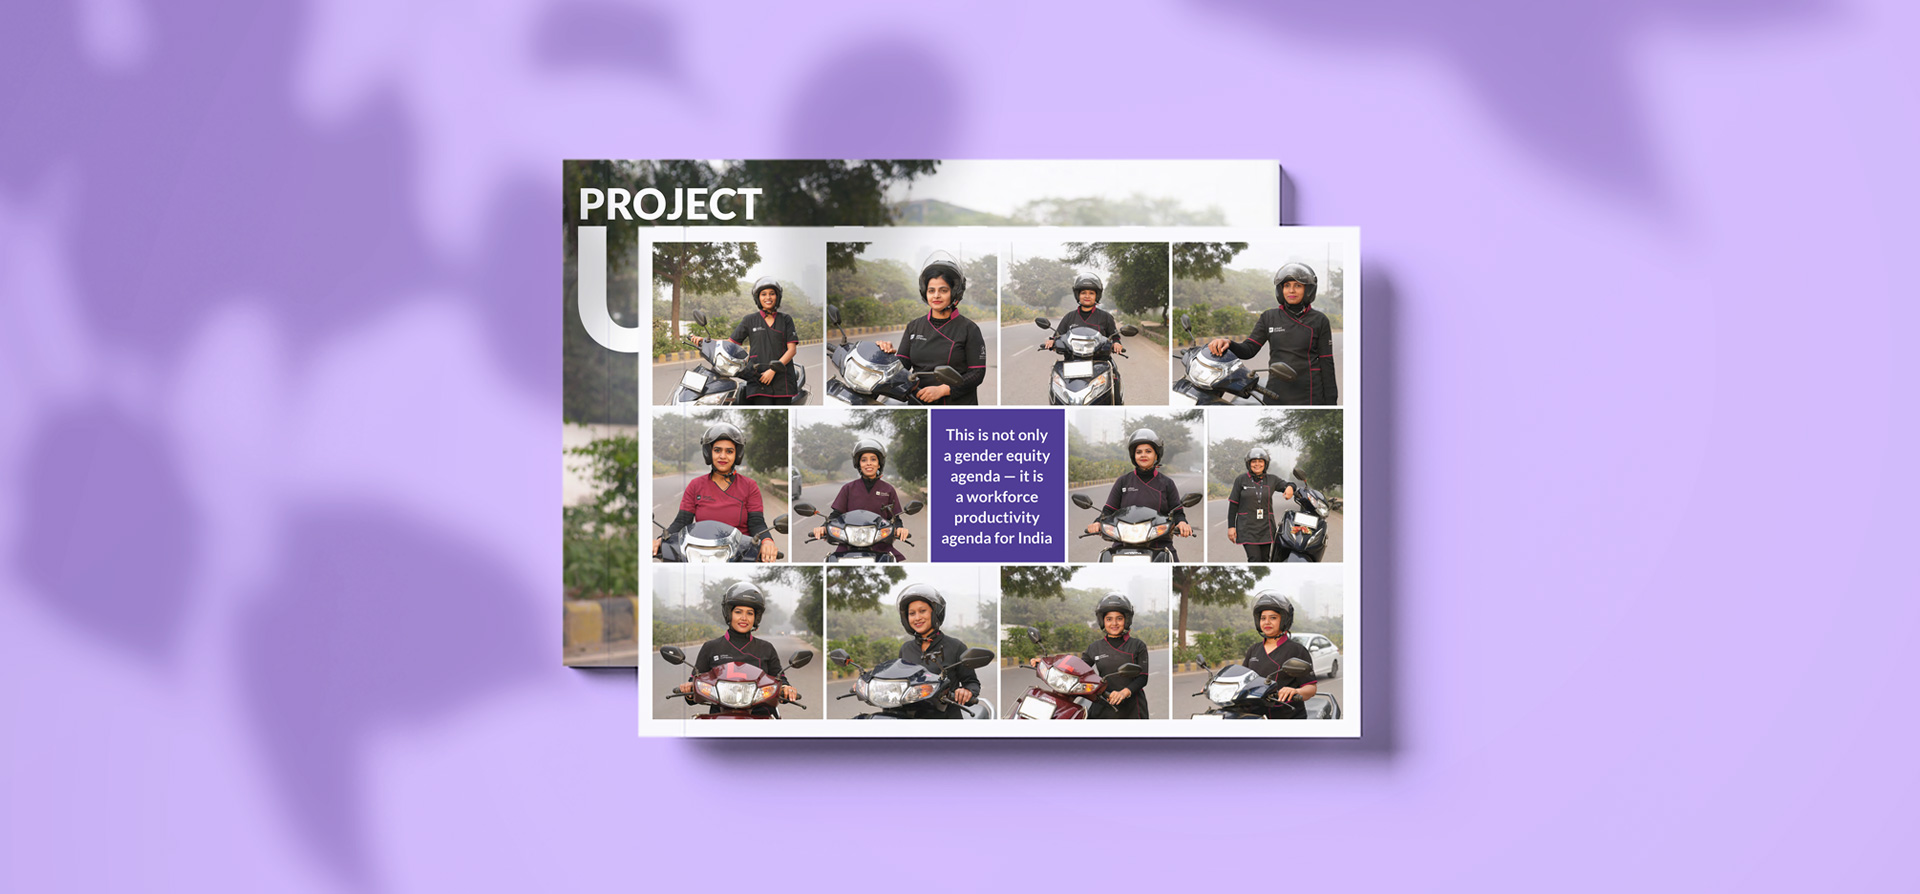
Women riders in helmets beside their scooters.

Client Overview​

Urban Company is a technology-led services platform. Its mobility initiative worked with banks and financial institutions to help workers buy scooters. With their own transport, workers could travel more easily, complete more jobs and improve their earning potential.
The company wanted to share this with its leadership and wider corporate audience. The report had to carry the data behind the program, and also the real experiences of the women workers who benefited from it.

Business Challenge

Urban Company had the data and the real stories of the women workers who benefited from the mobility initiative. But a report full of statistics is easy to put down, and stories without numbers are hard to take seriously. The challenge was to bring both together into something clear, engaging and easy to follow. 

The key challenges included:

  • Presenting a data-heavy report in a way that feels engaging and not overwhelming.
  • Showing the connection between mobility, completed jobs, earnings and quality of life.
  • Bringing real worker stories and statistics together so each supports the other.
  • Finding the right visual style for the report.
  • Keeping the design consistent across print and digital formats.


The objective was to create a report that leadership would value and readers would finish.

Our Approach

The design approach focused on making a data-heavy report feel engaging, human and easy to navigate. Instead of presenting the information as conventional text and statistics, key findings were translated into infographics, visual data points and structured content sections.
Real photographs of the women workers were incorporated throughout the report to give the stories an authentic and human dimension. The visual hierarchy was carefully designed to help readers quickly understand the key findings while maintaining a professional visual language appropriate for Urban Company.
The report was developed for both digital and print consumption, ensuring consistency across both formats.

Contemplative Portrait fnk re
Urban Cyclists Serenity
Collaborative Work Session
nkLC12rAR56ibf4tRP0JYBiA

Technology Ecosystem

/ Design

• Adobe XD • Adobe Illustrator • Adobe Photoshop

/ Publication & Production

• Digital Report Design • Print-Ready Artwork • Print Production Coordination

Solution Delivered

DesignDemonz provided complete impact report design and production services, from content planning to final print.

Editorial Layout

A clean, magazine-style layout was designed for this corporate report, built around readability and storytelling.
Key elements include:

  • Complete report design
  • Content flow planning
  • Typographic hierarchy
  • Visual hierarchy
  • Consistent page styling
  • Easy-to-navigate sections

Infographics & Data Visualization

Our infographic report design turned key data into simple visuals that readers can understand at a glance.
Major visuals include:

  • Key statistics
  • Visual data points
  • Charts and diagrams
  • Mobility-to-earnings visuals
  • Consistent infographic style

Photography & Storytelling

Real photographs were used to give the program a genuine, human face.
This includes:

  • Real worker photographs
  • Worker stories
  • Image editing and styling
  • Page-wise photo placement
  • Data and story balance

Digital Report

A web version of the annual report design was created for comfortable reading on screen.
The digital report includes:

  • Complete web version
  • Screen-friendly layout
  • Same look as print
  • Easy online sharing

Print-Ready Production

Print-ready artwork was prepared, with hands-on support through printing.
This includes:

  • Print-ready artwork
  • Printer coordination
  • Print quality checks
  • Final production support

Business Results

The impact report design for the Urban Company Mobility Report clearly communicated the impact of the mobility initiative through data visualization, storytelling and real worker experiences, in a format that leadership and readers could easily understand.

The collaboration resulted in:

  • A report that made complex information accessible and engaging.
  • Real worker stories presented alongside the data.
  • Appreciation from the leadership team.
  • Strong internal engagement and influence.
  • A consistent look across digital and print versions.
  • A smooth print production process, with the final report produced as intended.


Together, the data, the design and the stories turned the mobility initiative into something people could understand and remember.


Why DesignDemonz?

Impact reports, annual reports, CSR reports and sustainability reports all face the same problem: a lot of information and readers with little time. As a report design agency, we focus on making that information clear without losing the human side of the story.


From editorial layouts and infographics to digital versions and print production, we handle the full journey, so you get a finished report and not just design files.
Whether it’s an annual report, a corporate report or a data visualization project, DesignDemonz helps you turn information into something people want to read.

/ Let's Build Your Next Report

Got data and real stories that deserve more than a spreadsheet? Whether it’s an impact report, a CSR report or an annual report, DesignDemonz can turn your numbers and people’s stories into a report that is clear, engaging and easy to remember, as we did for Urban Company’s Mobility Report.

Let’s talk about your project and create a report your readers will actually finish.